San Francisco State University is part of the largest system of higher education in the country granting bachelor's and master's degrees, the California State University (CSU). Though it began as a school for local educators, today SFSU’s more than 304,000 graduates are leaders in science, business, public service, journalism and the arts — virtually every sphere of activity — around the globe.
- U.S. News & World Report ranked SFSU 30th in the nation for social mobility in its 2025 Best Colleges list.
- SFSU was given 4.5 out of 5 stars in Money’s Best Colleges in America 2025 list.
- The Hispanic Outlook on Education Magazine ranked SFSU among the Top 100 Colleges and Universities for Hispanics.
- SFSU has earned the prestigious Seal of Excelencia granted by Excelencia in Education, the nation’s premier authority on efforts to accelerate Latinx student success in higher education.
- College ranking and review platform Niche gave SFSU an A for Diversity and a B+ for Value.
- SFSU has one of the top 50 film schools in the country, according to The Wrap.
- SFSU alumni have won 22 Pulitzers, 16 Oscars, 55 Emmys, 10 Grammys and 13 Tonys.
- SFSU was the first U.S. university to establish a College of Ethnic Studies and an international relations department.
- Notable alumni include: billionaire investor and philanthropist Chris Larsen; founder and CEO of EMPIRE Ghazi Shami; President and CEO of Sephora North America Artemis Patrick; filmmaker and musician Boots Riley; Cherokee activist Wilma Mankiller; former San Francisco Mayor Willie Brown Jr.; dancer and choreographer Alvin Ailey; bebe stores CEO Manny Mashouf; Pulitzer Prize-winning journalist Jose Antonio Vargas; “A Lesson Before Dying” author Ernest J. Gaines; actors Dana Carvey, Alex Borstein, Annette Bening, Delroy Lindo and Carl Weathers; and singers Kirk Hammett and Johnny Mathis.
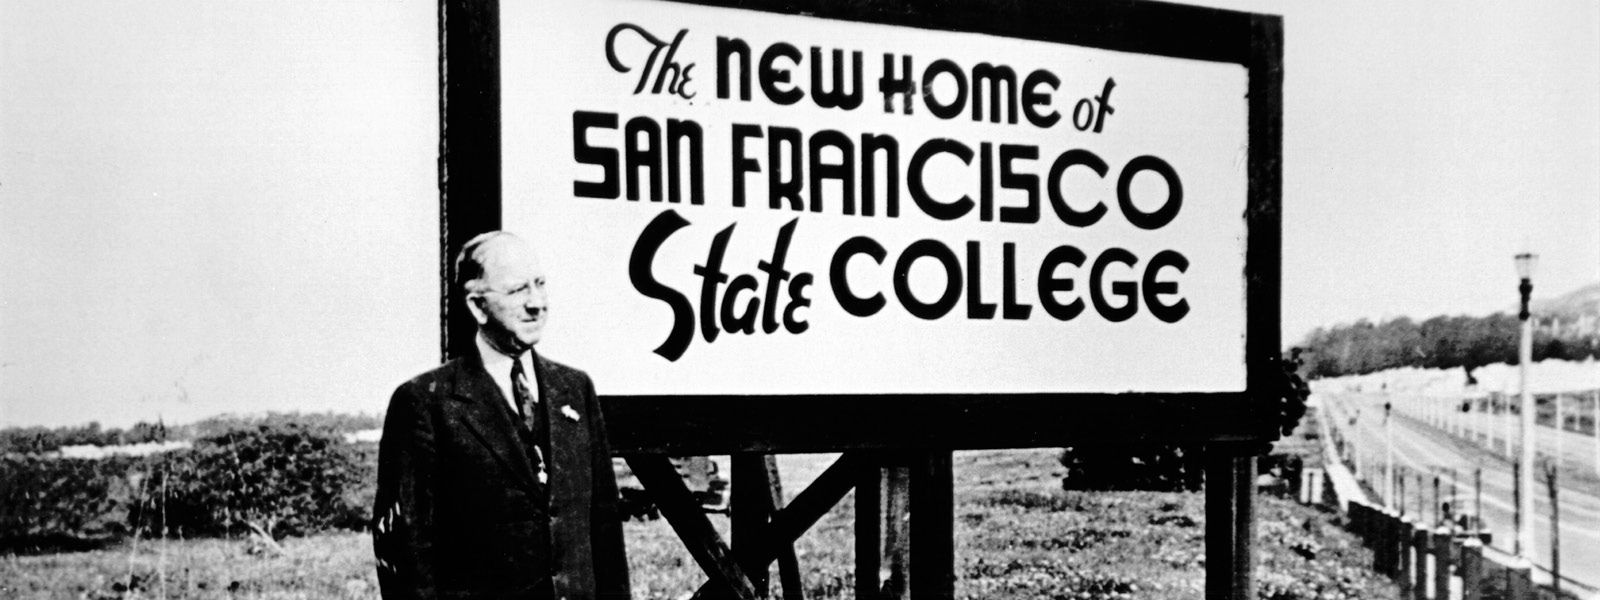
For over a century, San Francisco State University has distinguished itself as a vibrant center of scholarship, innovation and community engagement. Though it began as a school for local educators, today its graduates are leaders in science, business, public service, journalism and the arts — virtually every sphere of activity — around the globe. Founded in 1899 by an act of the California legislature, the San Francisco State Normal School was created to fill the city's acute need for well-trained, experienced teachers. The first graduating class — the class of 1901 — consisted of three dozen students, all women. In 1935, the school was renamed San Francisco State College. To accommodate growing demand, it moved in 1954 to its present campus near Lake Merced. In 1961, it joined what would become the 23-campus California State University system, and in 1974 the college was given a new name: San Francisco State University.
University Milestones
1901 - First graduating class (36 women)
1904 - First man admitted
1923 - First bachelor of arts degree
1930 - Four-year program initiated
1935 - Liberal arts program first offered
1949 - Master's degree first offered
1960 - SF State becomes part of the California State College system (now the California State University)
1972 - University status attained
Names
San Francisco State Normal School (1899 - 1921)
San Francisco State Teachers College (1921 - 1935)
San Francisco State College (1935 - 1972)
California State University, San Francisco (1972 - 1974)
San Francisco State University (1974 - present)
Presidents
Frederic Lister Burk (1899 - 1924)
Archibald B. Anderson (1924 - 1927)
Alexander C. Roberts (1927 - 1945)
J. Paul Leonard (1945 - 1957)
Glenn S. Dumke (1957 - 1961)
Paul A. Dodd (1962 - 1966)
John Summerskill (1966 - 1968)
Robert R. Smith (1968)
Samuel I. Hayakawa (1968 - 1973)
Paul F. Romberg (1973 - 1983)
Chia-Wei Woo (1983 - 1988)
Robert A. Corrigan (1988 - 2012)
Leslie E. Wong (2012 - 2019)
Lynn Mahoney (2019 - present)
Mascot
The Gator (alligator). Selected by students in 1931, it was originally spelled with an "er" — Golden Gaters — a play on words to emphasize SF State's location.
Athletics Teams
Men: basketball, cross country, track & field and wrestling
Women: basketball, cross country, soccer, softball, track & field and volleyball
Affiliation: NCAA Division II, California Collegiate Athletic Association (CCAA) and Mountain Pacific Sports Federation (MPSF) affiliated member in wrestling
Campus Size
Main campus: 144.1 acres
Sierra Nevada Field Campus: approx. 7.1 acres
| Enrollment Type | Number | Percent |
|---|---|---|
| Undergraduate | 17,607 | 85% |
| Post Baccalaureate/Graduate | 3,114 | 15% |
| TOTAL | 20,721 | 100% |
| Ethnicity | Number | Percent |
|---|---|---|
| Black | 1,343 | 6.5% |
| American Indian | 36 | 0.2% |
| Asian | 5,204 | 25.1% |
| Latinx | 8,015 | 38.7% |
| Unknown | 1,039 | 5% |
| Pacific Islander | 110 | .5% |
| Two or More Races | 1,339 | 6.5% |
| White | 3,635 | 17.5% |
| Achievement | Number | Percent |
|---|---|---|
| First in their families to attend college | 6,804 | 33% |
| Student Status | Number | Percent |
|---|---|---|
| Receiving Financial Aid | 16,700 | 80% |
SF State awards:
- Bachelor's degrees in 75 academic areas with an additional 49 areas of concentration
- Master's degrees in 65 academic areas with an additional 25 areas of concentration
- Doctor of Education (Ed.D.) in Educational Leadership with 2 concentrations
- Ph.D. in Education with a concentration in special education
- Clinical doctorate of physical therapy (D.P.T.), jointly with UC San Francisco
- 18 credential programs and 53 certificate programs
| College | Student Count |
|---|---|
| Psychology | 1,627 |
| Computer Science | 1,312 |
| Business Administration (Marketing) | 629 |
| Business (General Business) | 540 |
| Nursing | 534 |
| Business (Finance) | 526 |
| Cinema | 514 |
| Kinesiology | 495 |
| Criminal Justice Studies | 491 |
| Business (Accounting) | 488 |
| Employee Type | Number | Percent |
|---|---|---|
| Faculty | 1,369 | 43% |
| Staff | 1,343 | 42% |
| Academic Student Employees | 464 | 15% |
| TOTAL | 3,176 | 100% |
| Faculty Type | Number | Percent |
|---|---|---|
| Tenured/Tenure-track* | 665 | 48% |
| Lecturers | 696 | 51% |
| Counselors | 8 | 1% |
| TOTAL | 1,369 | 100% |
*This percentage considers head count only; it does not reflect tenure density.
| Faculty Gender | Number | Percent |
|---|---|---|
| Male | 289 | 43% |
| Female | 375 | 56% |
| Non-Binary | 1 | 0% |
| TOTAL | 665 | 100% |
| Faculty Ethnicity | Number | Percent |
|---|---|---|
| African American | 34 | 5% |
| American Indian | 13 | 2% |
| Asian American | 167 | 25% |
| Filipino | 15 | 2% |
| Hispanic/Latino | 48 | 7% |
| Other Non-White | 0 | 0% |
| Pacific Islander | 2 | 0% |
| White | 318 | 48% |
| Not Stated | 68 | 10% |
| TOTAL | 665 | 100% |
| Employee Group | Number | Percent |
|---|---|---|
| Clerical and Administrative Support | 95 | 7% |
| Technical and Paraprofessional | 634 | 47% |
| Management | 215 | 16% |
| Academic Support | 163 | 12% |
| Service and Maintenance | 132 | 10% |
| Skilled Crafts | 60 | 4% |
| Health Care | 28 | 2% |
| Public Safety | 16 | 1% |
| TOTAL | 1,343 | 100% |